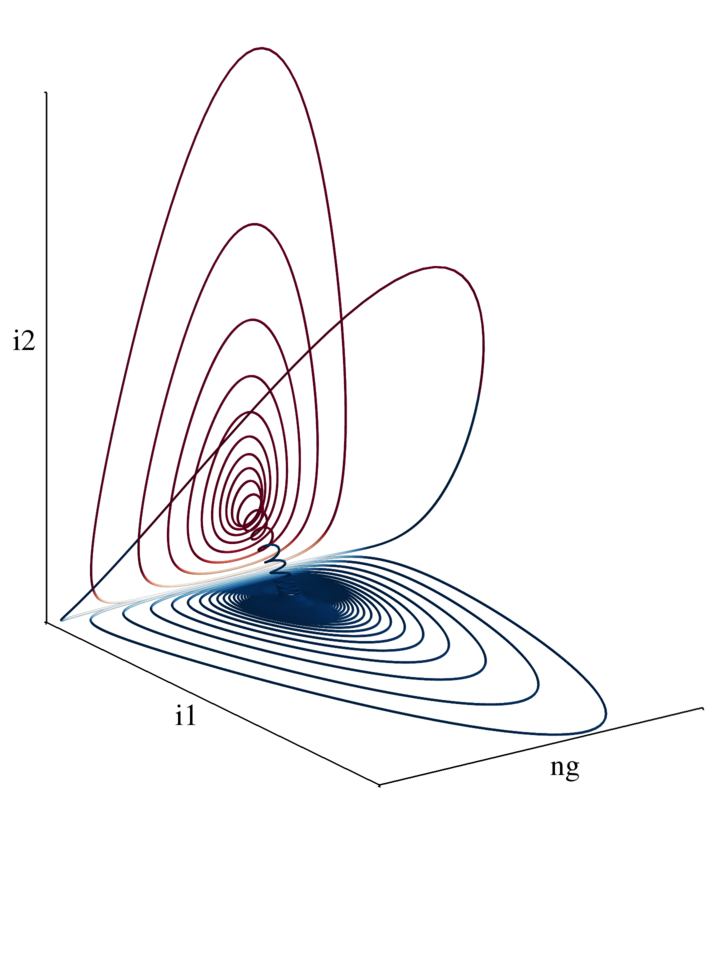
from mayavi import mlab
import pandas as pd
import numpy as np

i1 = np.array(pd.read_csv('i1.dat'))
i2 = np.array(pd.read_csv('i2.dat'))
ng = np.array(pd.read_csv('ng.dat'))

colors = np.zeros_like(i1)

for i in xrange(colors.size):
  colors[i] = abs(i1[i] + i2[i])
  if i1[i] < i2[i]:
    colors[i] = colors[i]*-1

mlab.options.offscreen = True

fig = mlab.figure(size=(1800,2800),bgcolor=(1,1,1))
fig.scene.parallel_projection = True

mlab.plot3d(20*ng, i1, i2,colors,colormap='RdBu',tube_radius=0.04,vmax=1.0,vmin=-1.0)

ax = mlab.axes( color=(0,0,0))
ax.property.line_width = 3.
ax.axes.label_format = ''
ax.axes.x_label= ''
ax.axes.y_label= ''
ax.axes.z_label= ''

mlab.draw()
mlab.view( 55, 70, focalpoint='auto', distance='auto' )

mlab.savefig('mayavi_phase_space.png')
titles, axis lables, sizes etc
mostly inspired by this discussion.. here, Gael suggests using inkscape to add labels and stuff.. this is definitely a potential approach, however, if you'd like to be able to easily reproduce the plot in the future without having to mess around in a GUI, ImageMagick is a great choice..
so, to chop off the edges of the plot..
~/ $ convert mayavi_phase_space.png -gravity North -chop 0x600 -gravity South -chop 0x250 \
                                    -gravity East  -chop 200x0 -gravity West  -chop 150x0 chopped_phase_space.png
and add our axis labels..
~/ $ convert chopped_phase_space.png -font Times-Roman -pointsize 60 -draw \
                              "text 25,700 'i2';text 350,1450 'i1';text 1100,1550 'ng'" annotated_phase_space.png
the nice thing about this approach is that it makes all messing about at the
end easily reproducible..
the finished product